Appliance Policy Efficiency Analysis Widget
Appliance Policy Efficiency Analysis Widget
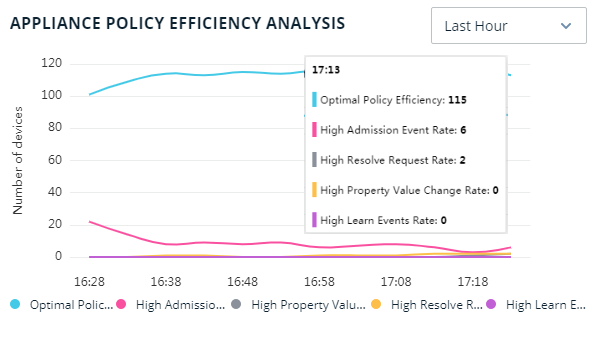
View whether policies are performing efficiently on Appliances in your deployment.
This widget displays the number of Appliances with optimal policy efficiency, as well as the number of Appliances that have high (sub-optimal) rates of the following policy-related factors:
-
Admission Event Rate: Average rate of new endpoints being admitted into the network, per minute.
-
Property Value Change Rate: Average rate that property values are changing, per minute.
-
Learn Events Rate: Average rate that plugins report to the Forescout platform about new learned properties, per minute.
-
Resolve Request Rate: Average rate that requests to resolve endpoint properties are made, per minute.
 minute read