Forescout eyeSight widget chart type
Custom widgets can be visualized as one of the following chart types:
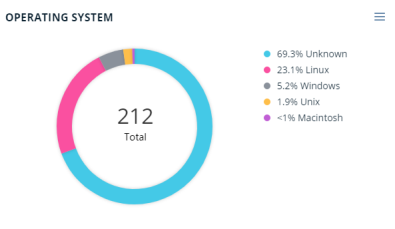
- Donut: A circular chart that displays the number and relative percentages of devices that match individual sub-rules (up to ten) from a single policy. The total number of devices that match all selected sub-rules is displayed in the center of the donut.
Note: Unlike out-of-the-box classification widgets, which display up to two levels of values by hovering over slices of the donut, custom donut widgets display one level.
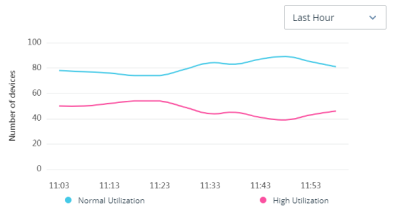
- Trend: A chart that displays the number of devices that match policy sub-rules over a set period of time (Last hour, 24 hours, week, month or year). Each sub-rule or sub-rule total represents a single line in the chart.
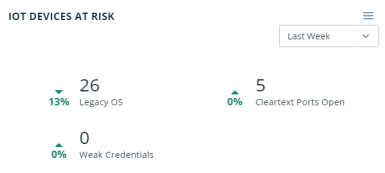
- Counter: Displays the number of devices that match policy sub-rules along with the percentage of change over a set period of time (Last hour, 24 hours, week, month or year). You can display up to four counters in each widget, plus an additional counter with the total number and percentage of all selected sub-rules. You can display trend arrows next to chart values and toggle the arrow indicator next to each sub-rule to configure whether upward and downward trend arrows are marked as positive or negative.
 minute read