SLA/SLO Dashboard
Selecting SLA/SLO from the Dashboards menu displays the SLA/SLO Analytics dashboard, which displays service metrics for customers who have Forescout Assist.
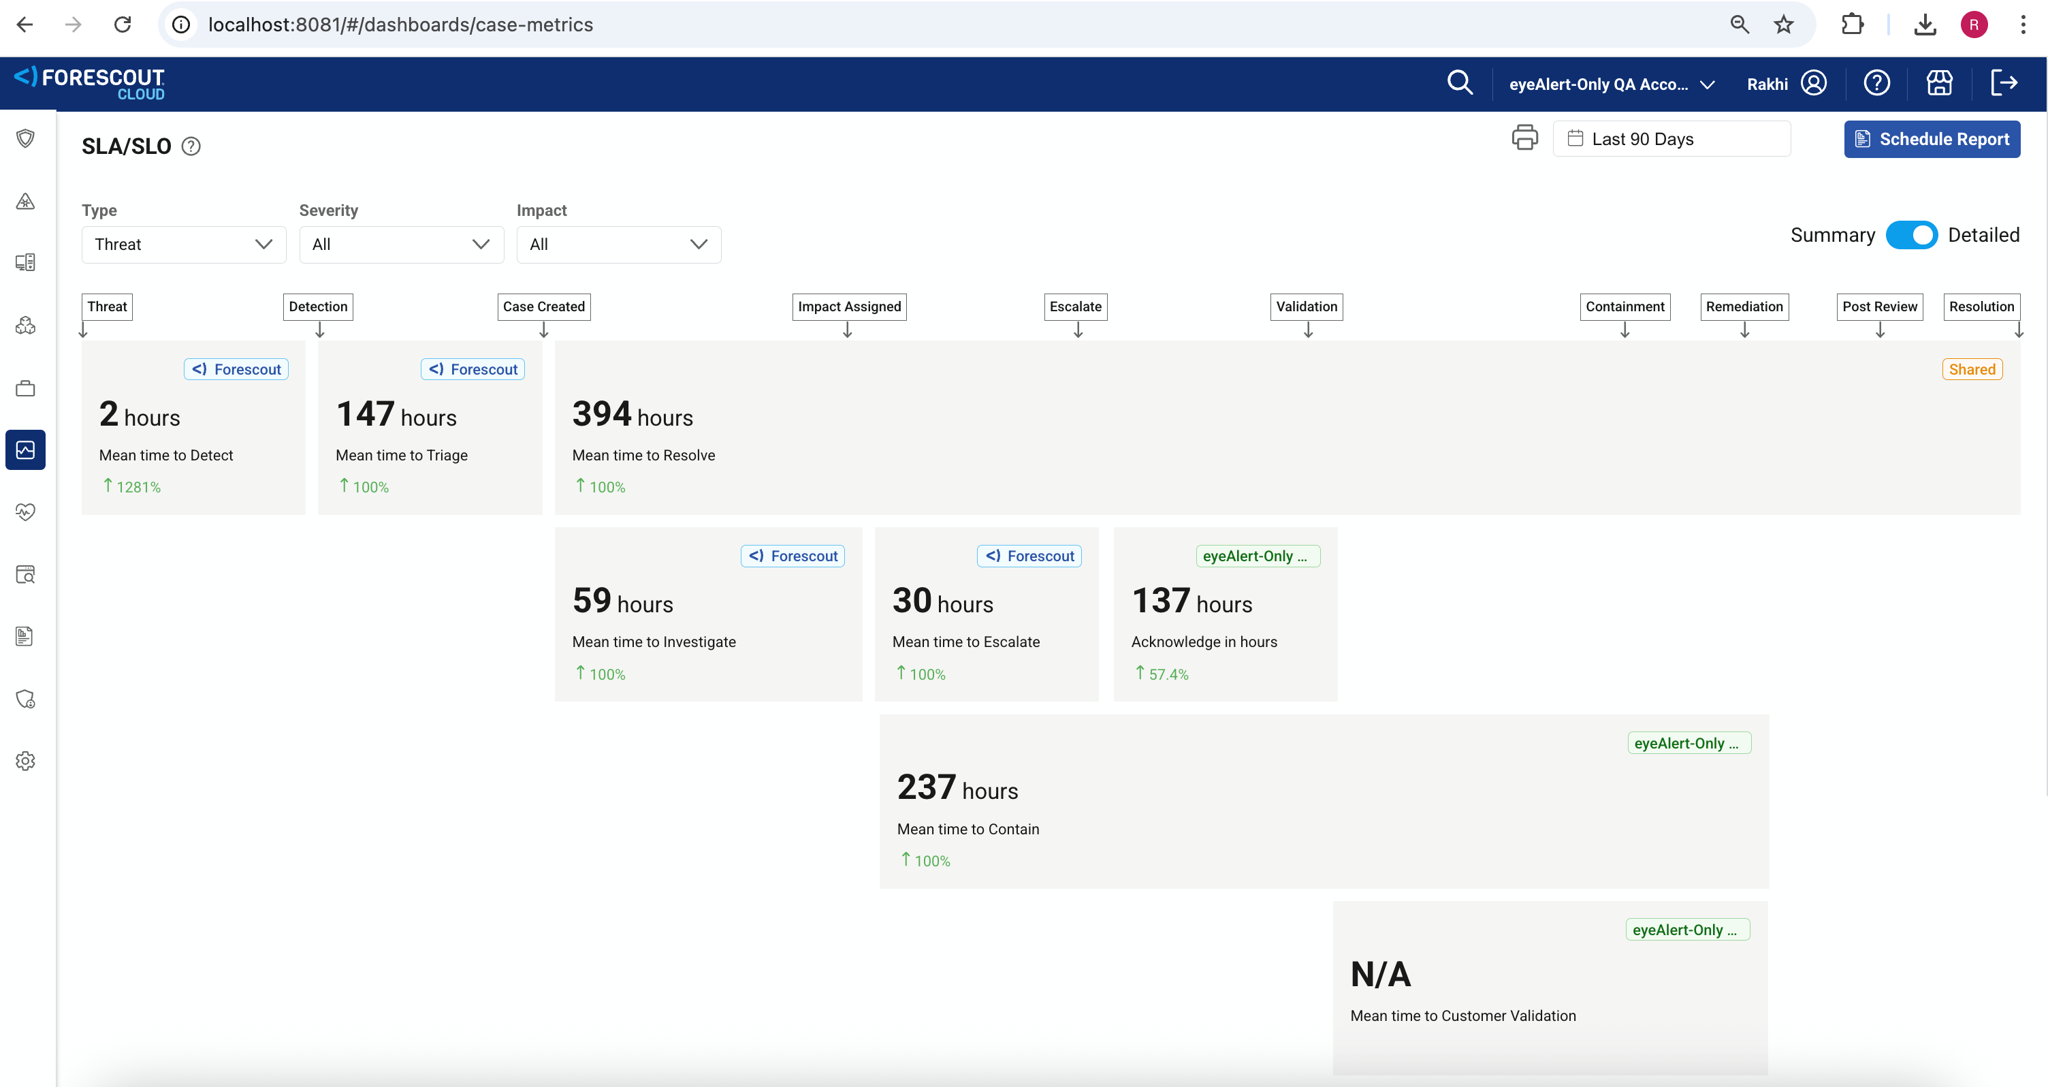
Dashboard Drill Down: Clicking on a portion of the dashboard displays relevant cases for the populated data.
Summary/Detailed Views: Enabled when the Type drop down is set to "Threat", clicking the Summary/Detailed toggle switches between a detailed display and a reduced display that focuses on the following four critical metrics:
- Mean time to Identify
- Mean time to Escalate
- Mean time to Contain
- Mean time to Resolve
Ownership indicator: The ownership indicator identifies the responsibility for driving individual metrics and has the following definitions:
- Forescout: Forescout is responsible for progressing the case during these statuses.
- Customer: The Customer needs to take action to progress these statuses.
- Shared: Both Forescout and the Customer have roles to play during these statuses.
The updated labels and case statuses in the SLA/SLO dashboard are tailored for customers using the Forescout SOC-Assist service. If you're not enrolled in SOC-Assist, some labels or stages may not appear or may not apply to your workflow.
Metrics filtering dropdown
-
TYPE – This dropdown allows you to filter metrics by incident type as either "Threat", "Technical Support", "Health", and "Change Request".
-
SEVERITY – This dropdown allows you to filter metrics by severity as either "Critical", "High", "Medium" or "Low".
-
IMPACT – This dropdown allows you to filter metrics by the five impact severity levels.
Mean Time metrics
- Mean Time to Detect – Measures the average time difference between the log timestamp that triggered an Indicator and the timestamp for the associated Detection that resulted in a Suspicious Entity being created.
- Meant Time to Investigate – Measures the average time difference between when a case is created, and the Case Impact is assigned. The Case must have a detection.
- Mean Time to Escalate – Measures the average time difference between when the Case Impact is assigned, and the status of the Case is changed to "Escalated to Customer". The Case must have a detection. The timer remains inactive irrespective of subsequent case status changes.
- Mean Time to Contain – Measures the average time difference between when a Security Incident Case Impact is assigned, and the status of the Case is changed to "Remediation".
- Mean Time to Respond – Measures the average time difference between when the Case Impact is assigned, and the Case status is changed to either "Post Review" or the Case is resolved. The Case must have a detection.
- Mean Time to Troubleshoot – Measures the average time difference between when the Case status is changed to "Submitted" and the Case status changes to "Troubleshooting".
- Mean Dwell Time – Measures the average time difference between the log timestamp that triggered an indicator and the Case status changes to either post review of the case is resolved.
- Mean Time to Triage - Measures the average time to create a Case after first detection.
- Mean Time to Resolve - Measures the average time difference between when a Case is created and when it is resolved. The Case must have an Impact.
- Mean Time to Identify - Measures the average time difference between the log timestamp that triggered an Indicator, and the Case Impact is assigned.
- Mean Time to Customer Validation – The average time difference between when a Security Incident case Status was changed to Escalated to Customer and when the case Status was changed to "Containment". The case must have transitioned to Containment in the selected time range.
- Mean Time to Acknowledge – The average time difference between when a Security Incident case Status was changed to Escalated To Customer and when the case Status was changed to another Status or Closed. The case Status must have changed to Escalated To Customer in the selected time range. For customers that use the "Customer Validation" status, then "Mean Time to Acknowledge" is the time between "Escalated to Customer" and "Customer Validation".
Report Scheduler
Clicking the Report Scheduler button displays a form to specify a report to be automatically generated and appended as a PDF to an email that is forwarded to recipients based on the following criteria:
-
SCHEDULER NAME– Specifies the name of the scheduled report.
-
DASHBOARDS– Specifies which dashboards will be included in the report.
-
SCHEDULE– Specifies whether the report should be run immediately, daily, weekly, or monthly.
-
RECIPIENTS – Specifies the recipients who will receive the report.
-
SUBJECT LINE (OPTIONAL) – Specifies an optional subject line for the report message.
-
MESSAGE (OPTIONAL) –dSpecifies a message for the report.