PQC Exposure Assessment dashboard
A post‑quantum cryptography (PQC) exposure assessment evaluates an organization’s cryptographic assets, such as algorithms, keys, protocols, and certificates, to identify quantum‑vulnerable methods, measure their level of exposure based on risk and data sensitivity, and prioritize remediation and migration to post‑quantum cryptography. The Forescout eyeFocus PQC Exposure Assessment dashboard provides a centralized, real‑time view of this cryptographic environment. It shows where and how your organization uses encryption, highlights areas that are vulnerable to future quantum attacks, and aggregates cryptographic telemetry into clear insights on risk exposure and quantum readiness across systems and devices.
Key features of the dashboard include:
-
Real-time metrics for quantum capability coverage, quantum-capable and non-quantum-capable asset counts, assets with protocol risks, the top 5 protocol weaknesses, and more.
-
Drill-down capabilities into related assets.
Navigate the dashboard
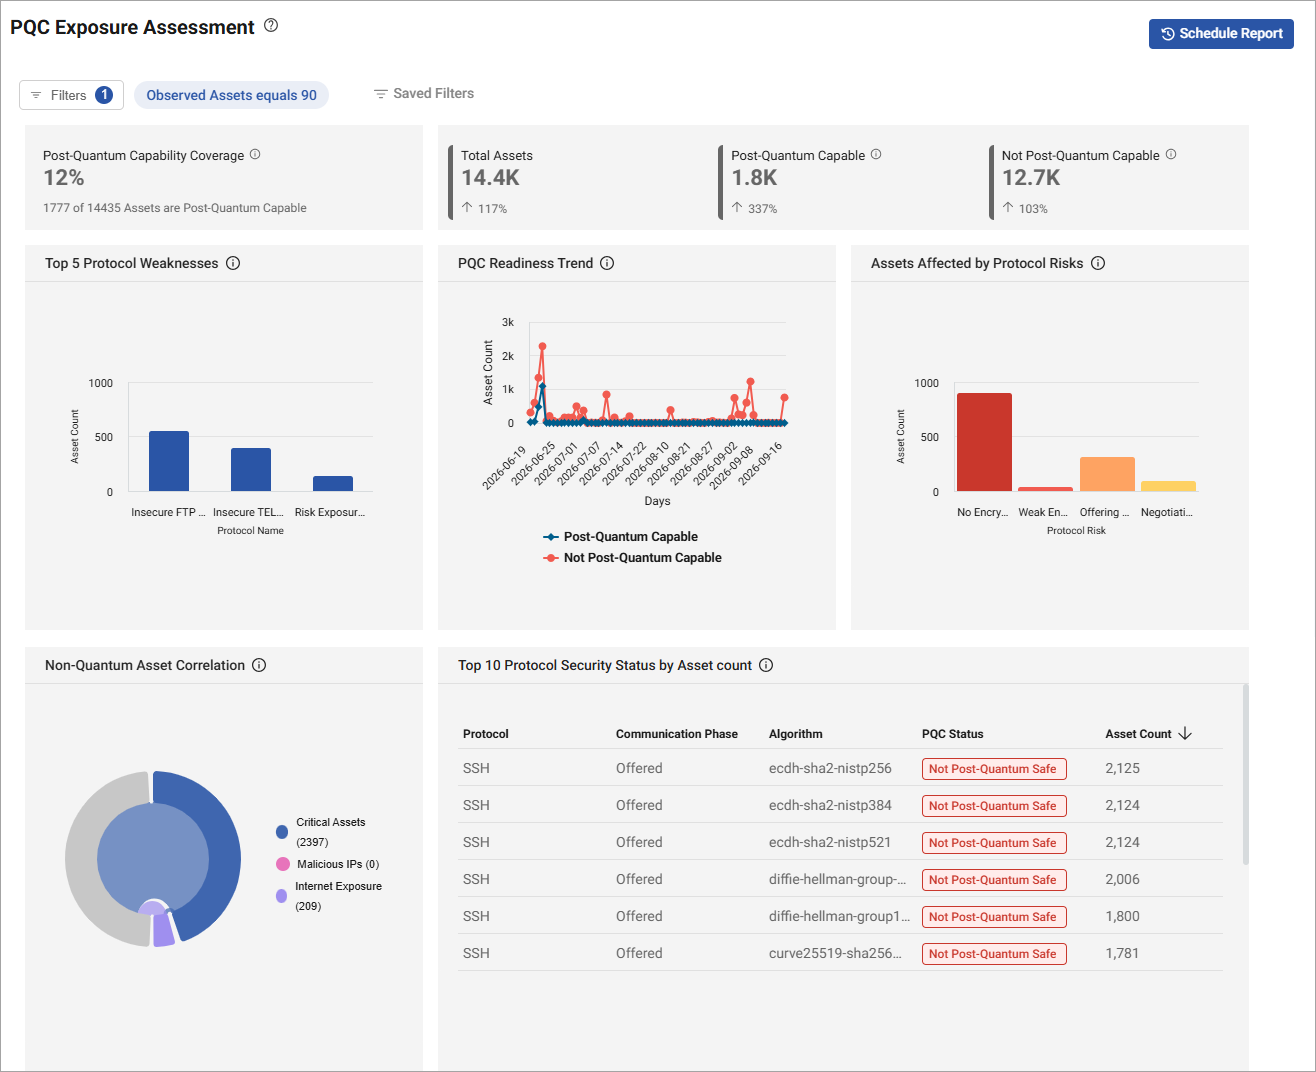
The PQC Exposure Assessment dashboard displays the following widgets.
| Widget | Description |
|---|---|
| Post-Quantum Capability Coverage | Shows the percentage of assets that are currently post-quantum capable. |
| Total Assets | Shows the total number of assets. |
| Post-Quantum Capable | Shows number of assets using cryptographic algorithms that are considered post-quantum resistant or post-quantum safe. |
| Not Post-Quantum Capable | Shows the number of assets that don't use any cryptographic algorithms that are considered post-quantum resistant or post-quantum safe. |
| Top 5 Protocol Weaknesses | Shows the five most frequently observed protocol-level weaknesses contributing to post-quantum and cryptographic risk based on affected asset count. |
| PQC Readiness Trend | Tracks the shift of assets from Not Post-Quantum Capable to Post-Quantum Capable over time. |
| Assets Affected by Protocol Risks | Shows the total number of assets affected by protocol-level risks categorized by risk type. The color of the bar in the chart is based on the category. |
| Non-Quantum Asset Correlation | Shows how non-post-quantum capable assets overlap across multiple risk categories. Overlapping in the chart indicates assets with more than one risk factor. |
| Top 10 Protocol Security Status by Asset Count | Displays protocol configurations and their post-quantum security status across network flows. |
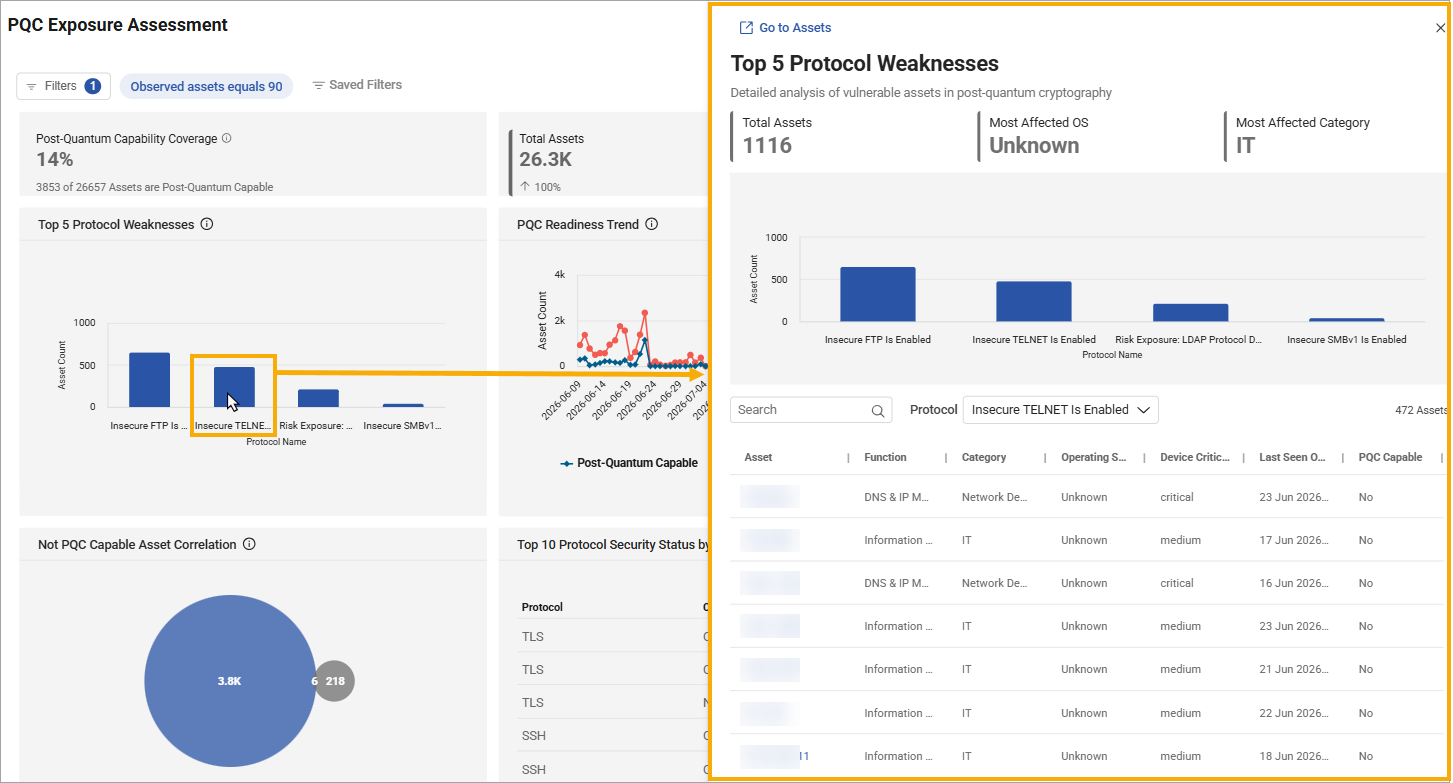
You can click any data point in a widget to open a drawer that shows detailed information, including related data and assets. You can also click the Go to Assets link to navigate to the Assets page view.
 minute read