Generate Forescout eyeSight reports and logs
Your Forescout Console is equipped with powerful report generation tools.
On-Screen Threat Protection Reports
These reports provide you with important system information about policies and detections; the services most frequently targeted by malicious endpoints; the origin of a worm outbreak or the infected endpoints in each network segment. You can also generate detailed reports on events, such as the number of probe and infection attempts per host or service, or the number and types of marks distributed over a time period. See On-Screen Threat Protection Reporting for details.
Real-time reports
You can generate comprehensive real-time reports regarding policy detections and endpoint discovery information. See Reports Portal for details.
Automated updates to these reports are available via the Modules pane.
Audit trails reports
You can view user audit trail reports that contain information about user activities during a specified time period. These reports can be exported. See Monitoring User Activity for details.
Forescout eyeSight On-Screen Threat Protection Reporting
This section details the Console reports.
Report results display activity that occurred within a specified time range for the Appliances that you select. For example, you can generate a report that covers a two-day, two-week, or two-month period, for one, several, or all the Appliances in your enterprise. By default, all Appliances are selected.
Executive reports
The Executive Report provides a concise overview of important Forescout platform and endpoint activities.
| Report | Details |
|---|---|
|
Executive Summary |
A detailed briefing of malicious endpoints activity and policy detections in your network during a specified time period. The report provides:
Report customization options let you adjust the following for the top 10 reports:
|
Operational reports
Operational reports provide extensive information about probe, scan, bite, and infection attempt events that occur at targets, endpoints and services in your network. These reports allow in-depth drill-down of security information gathered by Forescout products.
| Report | Details |
|---|---|
|
External Blocking |
Provides information about external blocking activity, including:
By default, the top 10 infected endpoints are displayed. This value can be changed from the Report Options dialog box. |
The following reports show information about infected endpoints in your network.
| Report | Details |
|---|---|
|
Worm Originator |
Displays the origin of a worm outbreak, tracking down the worm host to where it was originally detected in your network. |
|
Infected Hosts by Segment |
Displays the infected endpoints in your network, sorted by segment. Report options let you generate a table that lists the details of all the events shown in the report. |
|
Infected hosts by Service |
Displays the infected endpoints in your network, sorted by service. Report options let you generate a table that lists the details of all the events shown in the report. |
|
Top Worm-Infected Hosts |
Displays the IP addresses of infected endpoints that carried out the most infection attempts. By default, the top 10 infected endpoints are displayed. This value can be changed from the Report Options dialog box. Report customization options also allow you to:
|
The following reports give results of endpoint probing.
| Report | Details |
|---|---|
|
Probing Hosts by Segment |
Displays the probing endpoints in your network, sorted by segment. |
|
Probing Host by Service |
Displays the probing endpoints in your network, sorted by service. |
The following reports give details of email worm infection attempts.
| Report | Details |
|---|---|
|
Top email Infected Hosts |
Displays the endpoints in your network that generated the most email worm infection attempts. By default, results are limited to the 10 most active endpoints. You can change the default setting. Additional report customization options let you display only results greater than a set value. For example, show the results only if the endpoints generated more than five email events. |
|
Email Infected Hosts per Segment |
Lists endpoints in your network that generated email worm infection attempts, sorted by segment. Important information about each endpoint is presented, including the email address from which the attempt was made, the number of senders, and the number of mails sent. |
|
Related Worm Names for Hosts |
Displays endpoints, and names of high-profile worms that performed activities similar to that of the endpoint. You can load the most current related attack name file by selecting Load Related Attack Names from the Tools menu. This option installs new related worm names and the associated services that they attacked. Updated files can be found on the support page of the Forescout website. |
The following reports display information about infection attempts that occurred at the endpoints in your network.
| Report | Details |
|---|---|
|
Top Infection Attempts per Host |
Displays the most frequently targeted real endpoints in your network. The report lists the endpoint IP addresses and the number of infection attempts at each real endpoint. By default, the 10 most frequently targeted, real endpoints are displayed. This value can be changed from the Report Options dialog box. Additional report customization options let you display only results greater than a set value. For example, show the results only if the real endpoint was targeted more than 10 times. |
|
Infection Attempt Summary for a Selected Host |
Displays all infection attempts that targeted a specific endpoint. Report options let you generate a table that lists the details of all the events shown in the report. For example, the date and time the event occurred and the endpoint IP address that initiated the event. |
The following reports display information about services targeted in your network.
| Report | Details |
|---|---|
|
Infected Hosts / Targeted Hosts per Service |
Shows the number of infected endpoints that attempted to infect a service, and the number of endpoints in the network at which an infection attempt was carried out for that service. Report customization options let you adjust the following for the top 10 reports:
|
|
Top Infection Attempts per Service |
Displays the top infection attempts per service. The report displays the service and the number of infection attempts at each service. This lets you evaluate which services in your network are more attractive to worms and can help in analyzing the security mechanism protecting these services. By default, the 10 most frequently targeted services are displayed. This value can be changed from the Report Options dialog box. Additional options let you display only results greater than a set value, for example, display a service only if it was attacked more than 10 times. |
The following report display information about Scan policy results.
| Report | Details |
|---|---|
|
Scan Results |
Displays information regarding vulnerable machines detected in your network. The report lists the name of the vulnerability, the number of machines at which it was detected, as well as the number of services closed. By default, the 10 most common vulnerabilities detected in your network are displayed. This value can be changed from the Report Options dialog box. Report customization options allow you to: Display only results greater than a set value. Generate a table detailing report events. |
The following reports show activity statistics.
| Report | Details |
|---|---|
|
Infection Attempts Over Time |
Displays the number of infection attempt events that occurred during a specified time period. Report customization options allow you to: Define the intervals at which results are displayed, i.e., hourly, daily, or weekly. Generate a table detailing report events. |
|
Scan Detections Over Time |
Displays the numbers of scan events that occurred during a specified time period. Report customization options allow you to:
|
|
Top Bite Methods |
Displays the most common bite methods used over a specified time period, as well as the number of times each method was used. By default, the top 10 bite methods are displayed. You can update this value from the Report Options dialog box. Report customization options also allow you to:
|
|
Top Scan Methods |
Displays the most common scan methods used over a specified time period as well as the number of times each method was used. By default, the top 10 scan methods are displayed. You can update this value from the Report Options dialog box. Report customization options also allow you to:
|
|
Top Mark Types |
Displays the top mark types distributed during a specified time period, as well as the number of times each mark type was distributed. By default, the 10 most frequently distributed mark types are displayed. You can update this value from the Report Options dialog box. Report customization options also allow you to:
|
|
Top Always Allowed Services |
Shows the always allowed services that were most frequently accessed by blocked endpoints. Always allowed services are defined when creating exception rules from the Virtual Firewall pane. The results of this report help you evaluate the implications of maintaining always allowed services. By default, the 10 always allowed services that were most frequently accessed are displayed. This value can be changed from the Report Options dialog box. Report customization options also let you:
See Managing Your Virtual Firewall Policy for details. |
The following report displays information per Appliance.
| Report | Details |
|---|---|
|
Hosts Per Appliance |
Displays the number of endpoints handled at each Appliance in your enterprise as well as the average for all Appliances. By default, all Appliances are displayed. |
Generate on-screen threat protection reports
You can generate reports on-screen and access the on-screen management tools, such as printing and exporting reports.
To generate a report, select Reports > Threat Protection Reports > New.
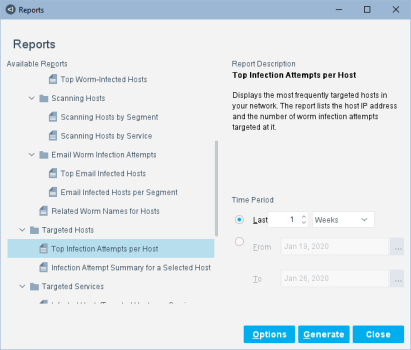
To display a list of open report windows, select Window > Reports and then select the report to open.
In a report window, select View > Report Definitions to display the definitions used to generate the report.
Customize reports
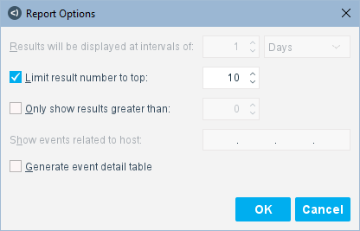
Reports are generated with default customization options. These options can be modified so that you can better manage results and view information that is important to you. The following report customization options are available for reports. Not all customization options are applicable to all reports.
If you update a default, it is only applied to the current report; after the report is generated, the default is restored.
In the Reports dialog box, select a report and time period, then select Options.
Work with on-screen report management tools
On-screen tools are available to manage and navigate your reports. These tools can be accessed from the menus and the report toolbar.



Save reports
The reports you save are stored by default at the location where you installed the Console.
Select to open a saved report.
To change the location for manually saved reports, select .
Reports portal
You can access a web-based Reports Portal to generate comprehensive real-time and trend information about policies, vulnerabilities and the network inventory.
The Reports Portal is enabled by the Reports Plugin, a component of the Forescout Core Extensions Module.
To access the portal, see Logging In to Forescout Web Portals.
The Reports Plugin lets you generate reports with real-time and trend information about policies, host compliance status, vulnerabilities, device details, assets and network guests.
Use reports to keep network administrators, executives, the Help Desk, IT teams, security teams or other enterprise teams well-informed about network activity. Reports can be used, for example, to help you understand:
- Long term network compliance progress/trends
- Immediate security needs
- Compliance with policies
- Status of a specific policy
- Network device statistics
You can create reports and view them immediately, save reports or generate schedules to ensure that network activity and detections are automatically and consistently reported.
In addition, you can use any language supported by your operating system to generate reports. Reports can be viewed and printed as either PDF or CSV files.
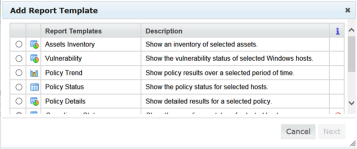
To add a report, select Add from the Reports portal home page. Select a report template, then select Next to define parameters and generate the report.
Work with system event logs
You can view logs about system activity, for example, successful and failed user login operations.
Not all users have access to this feature.
An option is also available to forward various event messages to third-party logging systems via the Syslog Plugin. For details, refer to the Syslog Plugin Configuration Guide..
To view events, select from the Console menu, and define a time period.
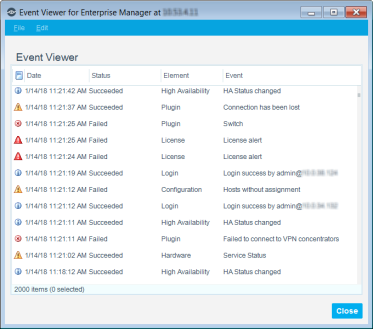
The following information is available:
 Emergency
 Alert
Alert Critical
 Error
Error Warning
 Notice
 Information
 Debug
DebugDouble-click an entry in the log to view more details about the event.
Select File > Clear All to clear all data from the table. This information remains in the system. Select File > Reload to load the latest data from the database.
Select Edit > Find to search for a text string in the event viewer.
Select File > Exports to save the log to a TXT or XLS file.
View block events
A Block Events log provides an at-a-glance display of the block events for the Virtual Firewall (VFW) and threat detections. For example:
- Host blocks
- Port blocks
- External Port blocks
- External Host blocks
- Services closed as a result of service attacks
- Services closed as a result of the blocking rules that you defined via the Virtual Firewall
Use the log to troubleshoot problematic network block events. You can export the information to a CSV file.
To view blocked events, select Blocking Logs from the Log menu, and then define a time period.
The following information is available:

Select View > Find to search for text.
If you selected a relative time when generating the block events list, select File > Refresh to include events blocked from the indicated start time, up to and including the current time while the dialog box is open.
View a history of monitored and blocked services
Your system policy may be defined so that your system monitors or blocks selected services in your network. You can view a history of the services that were monitored or blocked during a specific time period.
For information about how to work with these policy definitions, see Handling Service Attacks
Select Log > Service Attack History and define a time period.
The following information is available:
 minute read