Out-Of-The-Box (OOTB) Forescout eyeSight dashboards
Some dashboards are available OOTB with your eyeSight license. Other dashboards are optional and you can add them to Dashboards view.
Users who have Dashboards view permissions must also have each OOTB dashboard individually enabled in their User Profiles.
For information about Forescout eyeSight Web Client permissions, see Access to Forescout Console Tools Permissions for details about OOTB dashboard permissions.
Device Overview Counters
In some dashboards overview counters display the total number of devices detected in your deployment, and the number of devices of different categories.

Forescout eyeSight device visibility dashboard
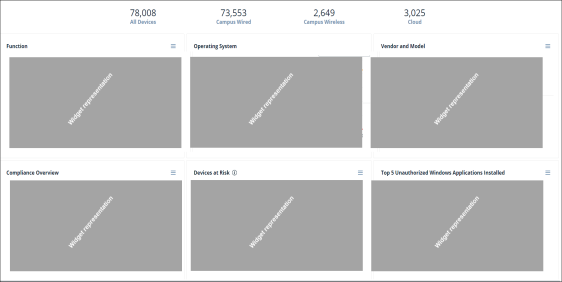
View at a glance, real-time inventory, compliance and risk data for devices on your network. This dashboard contains the following widgets, according to the following categories:
- Classification. These widgets provide a real-time view of diverse device functions, operating systems and models currently on the network based on information from Forescout Classification Properties. Each widget displays up to ten values for each property.
- Compliance. This widget displays a continuous assessment of device compliance posture.
- Risk
Forescout eyeSight Device Visibility Dashboard.
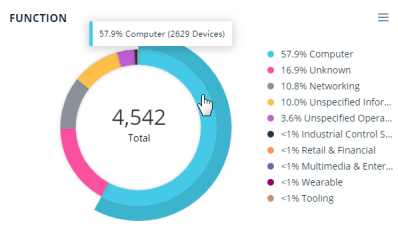
Function widget
View a breakdown of devices by function, as resolved by the Function property.
Two levels of values are displayed in the widget. The first level value is displayed as a slice in the donut, and the second level is displayed when you hover over a slice of the donut. For example, if a device is resolved as Accessory > VoIP > IP Phone, the widget will display Accessory as a slice in the donut, and VoIP when you hover over that slice. The third-level value is not displayed.
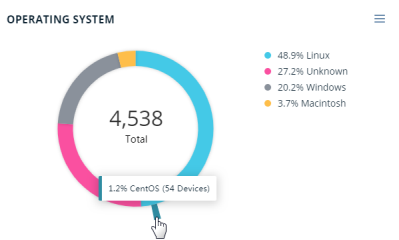
Operating system widget
View a breakdown of devices by operating system, as resolved by the Operating System property.
Two levels of values are displayed in the widget. The first level value is displayed as a slice in the donut, and the second level is displayed when you hover over a slice of the donut. For example, if a device is resolved as Linux > Debian, the widget will display Linux as a slice in the donut, and Debian when you hover over that slice.
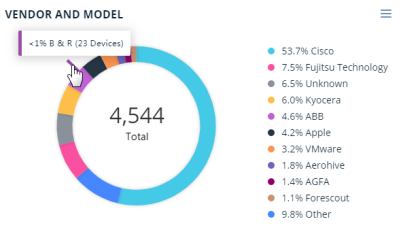
Vendor and model widget
View a breakdown of devices by vendor and model, as resolved by the Vendor and Model property.
Two levels of values are displayed in the widget. The first level value is displayed as a slice in the donut, and the second level is displayed when you hover over a slice of the donut. For example, if a device is resolved as Samsung > Samsung Galaxy Tablet > Samsung Galaxy Tablet 10, the widget will display Samsung as a slice in the donut, and Samsung Galaxy Tablet when you hover over that slice. The third-level value is not displayed.
Compliance overview widget
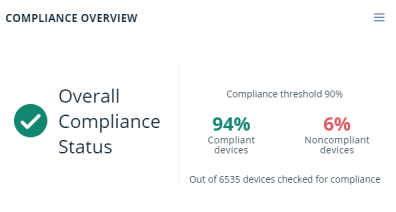
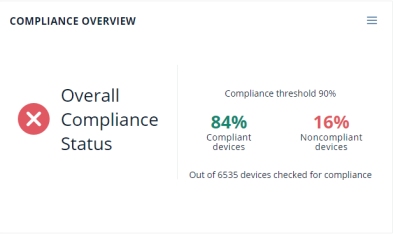
View a continuous, real-time assessment of device compliance posture.
This widget shows a breakdown of devices by their compliance
status (compliant / noncompliant), as resolved by the Compliance Status property. If the percentage of
compliant devices exceeds the compliance threshold (default: 90%), the overall
compliance status is Compliant .
.
If the percentage of compliant devices falls below the compliance
threshold, the overall compliance status is noncompliant , and corrective action is required.
Widgets in Out-of-the-Box Dashboards cannot be edited. You can Duplicate a Dashboard to create a copy of the dashboard, and then edit the copied widget to change the threshold percentage and title of the widget.
IoT devices at risk widget
View IOT devices that are prone to attack, which present a high risk to the cybersecurity posture. Analyze this widget's data to plan a strategy for minimizing the attack surface on the devices in your network and reducing the likelihood of security breaches.
The IoT Devices policy (created by the Dashboard Policies template) classifies the device as an IoT device and adds the device to the IoT Group. There are three more policies, one for each device type counter (Cleartext Ports Open, Weak Credentials, Legacy OS).
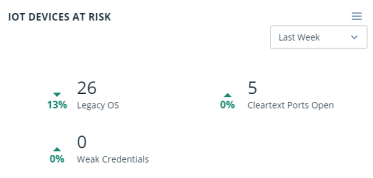
This widget displays the number of devices with:
- Cleartext Ports Open:
- Telnet port open
- FTP port open
- Weak Credentials
- Factory default credentials (SSH, Telnet or SNMP)
- Commonly used credentials (SSH, Telnet or SNMP)
- Legacy OS
- Running EOL OS's (Windows XP*, Windows 2000)
Top 5 unauthorized Windows applications installed widget
View the most common unauthorized Windows applications installed on devices in your network to focus on sources of potential security incidents.
This widget displays the top 5 unauthorized applications installed on Windows devices via Add/Remove Programs.
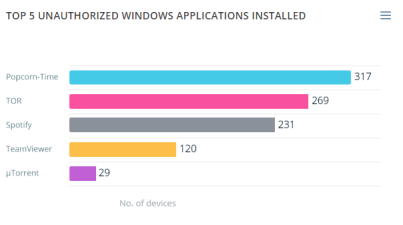
By default, this policy searches for devices that have the following unauthorized applications installed:
- Amazon Cloud Drive
- Bitcasa
- Box
- Copy
- Cubby
- CX
- Dropbox
- Google Drive
- iCloud Drive
- Mozy
- myflare
- OneDrive
- Popcorn-Time
- Spotify
- SugarSync
- Team Viewer
- TOR
- µTorrent
You can edit this list in the Console to change the applications that will appear in the Dashboard widget. Go to , and edit the Unauthorized Windows Applications list.
If you add more than five applications to the list, only those installed on the greatest number of detected devices appear in the widget. If you edit the list by importing values from a file, make sure the file is in TXT format and UTF-8 encoded.
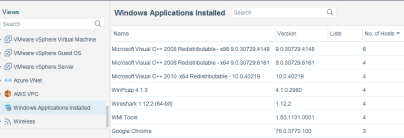
For a list of currently detected Windows applications installed, access the relevant view in the Asset Inventory page of the Console.
If you add applications that contain regular expression special characters (for example, *$+), you need to add a backslash (\) before every special character. For example, if you add Notepad++ (32-bit x86), you need to type Notepad\+\+ \(32-bit x86\).
Forescout eyeSight device compliance dashboard
View at a glance, real-time data for improving compliance hygiene for devices on your network.
Forescout eyeSight Device Compliance Dashboard:
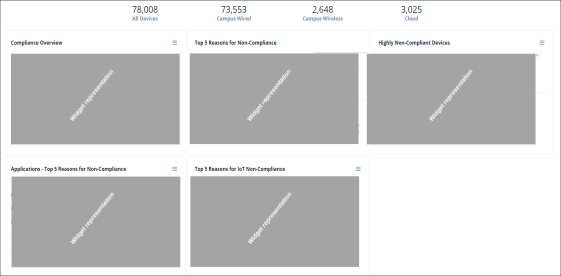
View a continuous, real-time assessment of device compliance posture.
This widget shows a breakdown of devices by their compliance status (compliant / noncompliant), as resolved by the Compliance Status property. If the percentage of compliant devices exceeds the compliance threshold (default: 90%), the overall compliance status is Compliant.
If the percentage of compliant devices falls below the compliance threshold, the overall compliance status is noncompliant, and corrective action is required.
Widgets in OOTB Dashboards cannot be edited. You can Duplicate a Dashboard to create a copy of the dashboard, and then edit the copied widget to change the threshold percentage and title of the widget.
Device Overview Counters
In some dashboards overview counters display the total number of devices detected in your deployment, and the number of devices of different categories.
Device Overview Counters
In some dashboards overview counters display the total number of devices detected in your deployment, and the number of devices of different categories.
Device Overview Counters
In some dashboards overview counters display the total number of devices detected in your deployment, and the number of devices of different categories.
Forescout eyeSight health monitoring dashboard
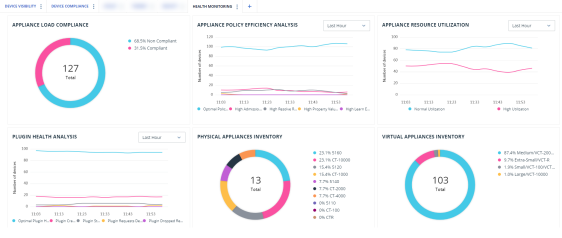
View at a glance, real-time data that helps you monitor and improve the health of Forescout Appliances in your deployment.
After you run the Health Monitoring Templates, this dashboard will be available as a public dashboard to add to your view. See Add a Dashboard to Your View for more information.
Appliance Load Compliance Widget
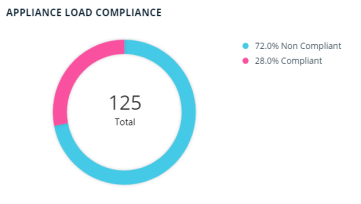
View the number and percentage of Appliances that are compliant with Forescout eyeSightload specifications as laid out in the Forescout Sizing Guide.
Load compliance is based on a detailed analysis performed by Appliance Load Compliance Policies, which analyze factors like HTTP Login Rate, traffic bandwidth, number of managed endpoints, and others. For a complete list of factors analyzed by this policy, see the list of properties in Health Monitoring - Load Specification Compliance.
Device Overview Counters
In some dashboards overview counters display the total number of devices detected in your deployment, and the number of devices of different categories.
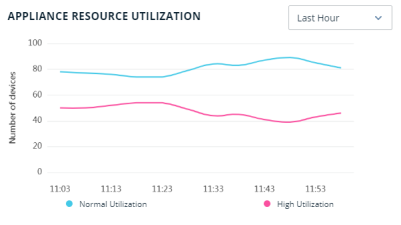
Appliance Resource Utilization Widget
View how effectively Appliances actually utilize their resources (irrespective of whether Appliance specifications are found compliant with Forescout guidelines - see Appliance Load Compliance Widget).
This widget displays the number of Appliances that have either 'high' or 'normal' resource utilization. This categorization is based on a detailed analysis performed by Appliance Resource Utilization Policies, which analyze factors like CPU usage, disk latency, packet loss, and others. For a complete list of factors analyzed by this policy, see the list of properties in Health Monitoring - Resource Utilization.
Device Overview Counters
In some dashboards overview counters display the total number of devices detected in your deployment, and the number of devices of different categories.
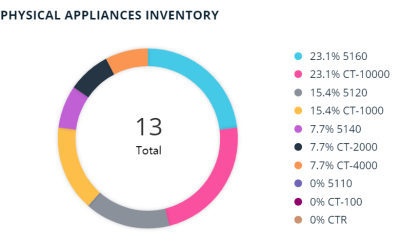
Physical Appliance Inventory Widget
View a list of all Forescout physical Appliances in your deployment, categorized by model/series. For example, if the Appliance model is 5120 (5100 Series) or CT-2000 (CT Series).
This categorization is based on the Physical Appliances Inventory policy, which uses the Forescout Device Models property (see Health Monitoring properties) to categorize Appliances.
For more information about physical Appliance models, including performance and machine specifications, refer to the Forescout Sizing Guide.
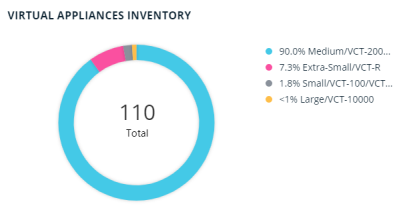
Virtual Appliance Inventory Widget
View a list of all Forescout virtual Appliances in your deployment, categorized by model/size. Virtual Appliances are grouped by size, as follows:
- Large/VCT-10000
- Medium/VCT-2000/VCT-4000
- Small/VCT-100/VCT-1000
- X-Small/VCT-R
This categorization is based on the Virtual Appliances Inventory policy, which uses the Forescout Device Models property (see Health Monitoring properties) to categorize Appliances.
For more information about virtual Appliance models, including performance and machine specifications, refer to the Forescout Sizing Guide.
 minute read