Work in the Forescout Console
The Forescout Console is the management application used for viewing information about endpoints and devices.
From the Forescout Console, you can view NAC compliance status, malicious intrusions, vulnerable endpoints, and real-time network inventories. In addition, the Console offers an extensive range of tools to analyze and manage these endpoints.
For the eyeSight Web Client, see Log In to the Forescout Console.
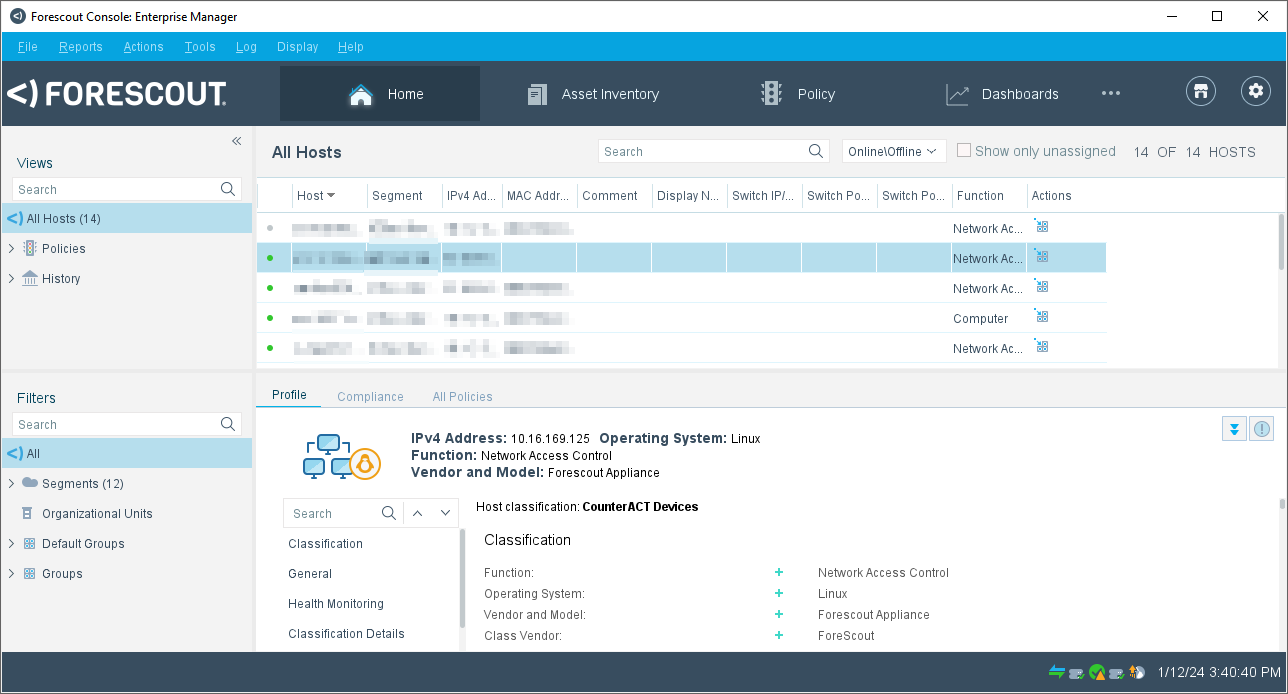
Forescout Console components
The following sections describe the key components of the Forescout Console window:
Title bar
The title bar displays the following information:
- eyeSight device IP address or host name.
- Login user name.
- eyeSight device connection status with the Console.
- Under certain circumstances, a user may have limited Scope access. Limited Scope access means that users cannot see or control many feature configurations in defined ranges and segments.
Under certain circumstances, a user may have limited Scope access. Limited Scope access means that users cannot see or control many feature configurations in defined ranges and segments. See Access to Network Endpoints - Scope for details.
Menu bar
The menu bar displays the Console menu options.
You can select More Space or Less Space in the Display menu to adjust the line spacing in the Console display.
Toolbar - Console views
Toolbar items provide quick access to important information and tools.
Endpoints detected on the network
To open the Home view, select the Home tab:
The Home view displays:
- Extensive real-time information about endpoints detected on your network, for example, endpoint details learned by eyeSight, information about endpoint policy status, and eyeSight actions applied to endpoints. See Working with Forescout Detections for details.
- The Forescout site map. The map, powered by Google®, provides at-a-glance, real-time information about endpoints across offices, cities, countries, and continents. See Working in the Site Map for details.
Adjust the view for viewing preferences by using the toggle arrow on the edge of the Forescout Console pane.
Asset Inventory
The Asset Inventory presents a live display of network activity at multiple levels, for example, running processes and services, detected vulnerabilities, open ports, and logged in users.
To open the Asset Inventory view, select the Asset Inventory tab:
Use the Asset Inventory to:
- Broaden your view of the network from endpoint-specific to activity-specific.
- View endpoints that have been detected with specific attributes, whether or not they are policy-compliant.
- Easily track network activity and elements.
- Incorporate inventory detections into policies. For example, if you discover that network guests are running unauthorized processes on your network, you can create a policy that detects and halts these processes on guest machines.
For details, see Working with Asset Inventory Detections.
Threats
Threats view displays endpoints detected via Threat Protection policies. Create and edit Threat Protection Policies from this view. See Threat Protection for details. The Threats tab can be shown or hidden.
To show or hide the Threat Protection tab, select , and then enable or disable the Show Threats View option.
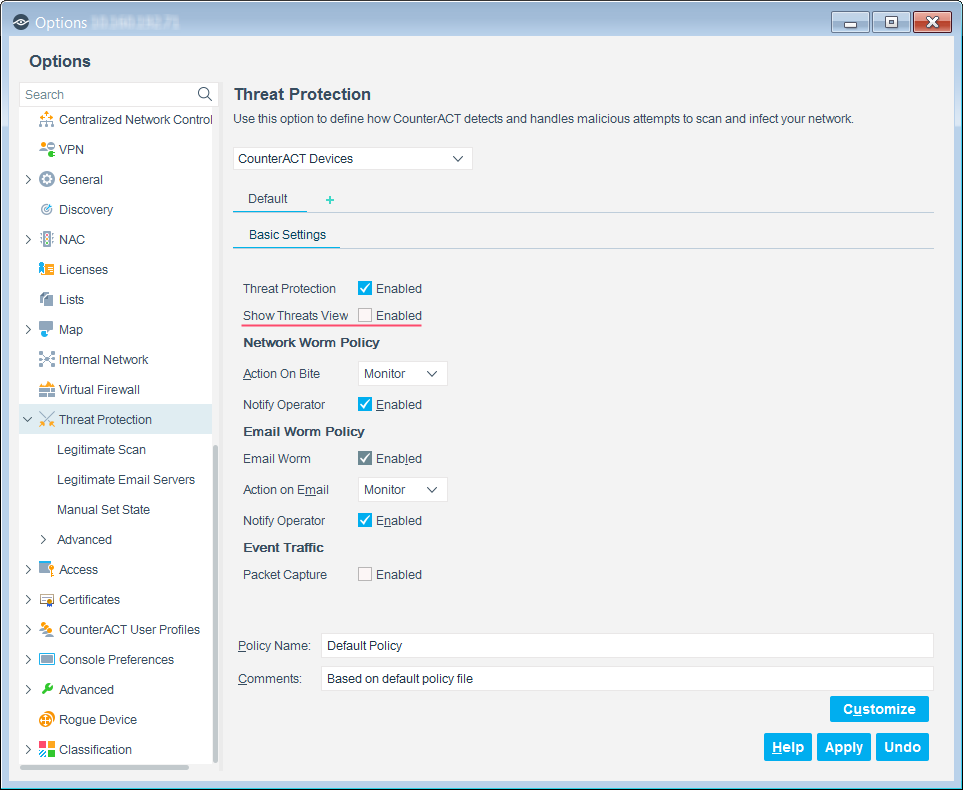
Customize the Threats View
Adjust the view for viewing preferences via the toggle arrows on the edge of the Forescout Console pane.
Policy management view
Use the tools in the Policy view to create, edit and manage policies.
To open the Policy Management view, select the Policy Management tab:
Dashboards (and Assets view)
Access the Dashboards (and Assets) view of the eyeSight Web Client. See Logging In to Forescout Web Portals for more information.
Dashboards display dynamic, at-a-glance information about:
- Device visibility
- Device compliance
- Health monitoring
- Forescout policy data, including custom policies
See Dashboards and Assets View for more information about these tools.
Assets portal, reports portal, and user portal builder
You can access the Assets Portal, Reports Portal and the User Portal Builder from the Forescout Console toolbar by clicking the ellipsis icon  .
.


Status bar
The status bar may display the following information:


Search in the Forescout Console
Use the search tool  to quickly access information from the Forescout Console, for example, in the Views pane, Detections pane, or the Modules pane. Items that match the search text appear as you type.
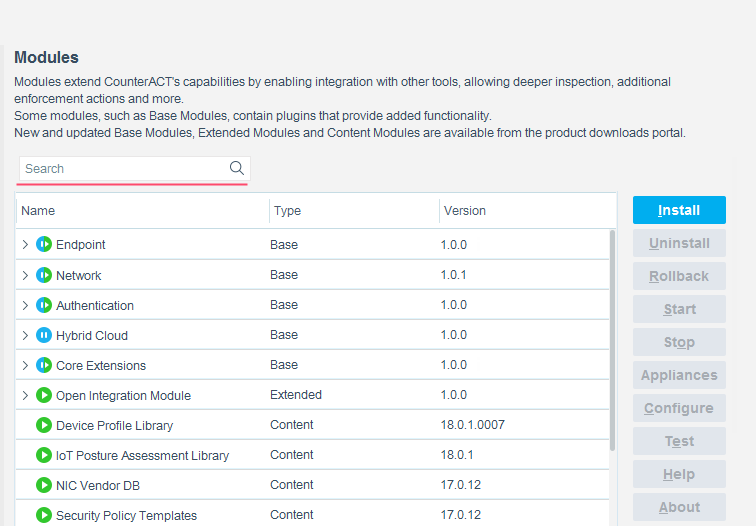
Where relevant, collapsed folders expand if the search item you entered is found in the folder. Some search bars can be hidden or displayed by clicking the pane header, for example, the Filters pane.
Work in the Forescout Console site map
The Forescout Console site map, powered by Google®, provides at-a-glance, real-time information about endpoints across offices, cities, countries, and continents. You can toggle between a Satellite view and a Map view.
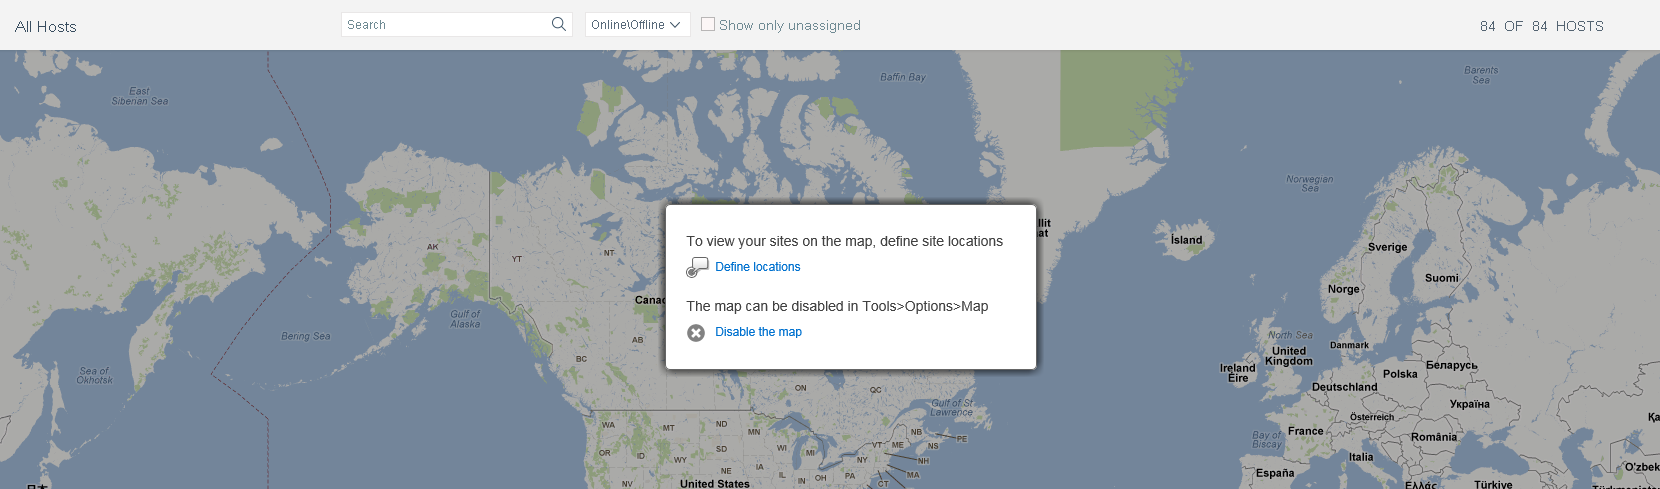
Endpoint information is displayed in the panes below the site map.
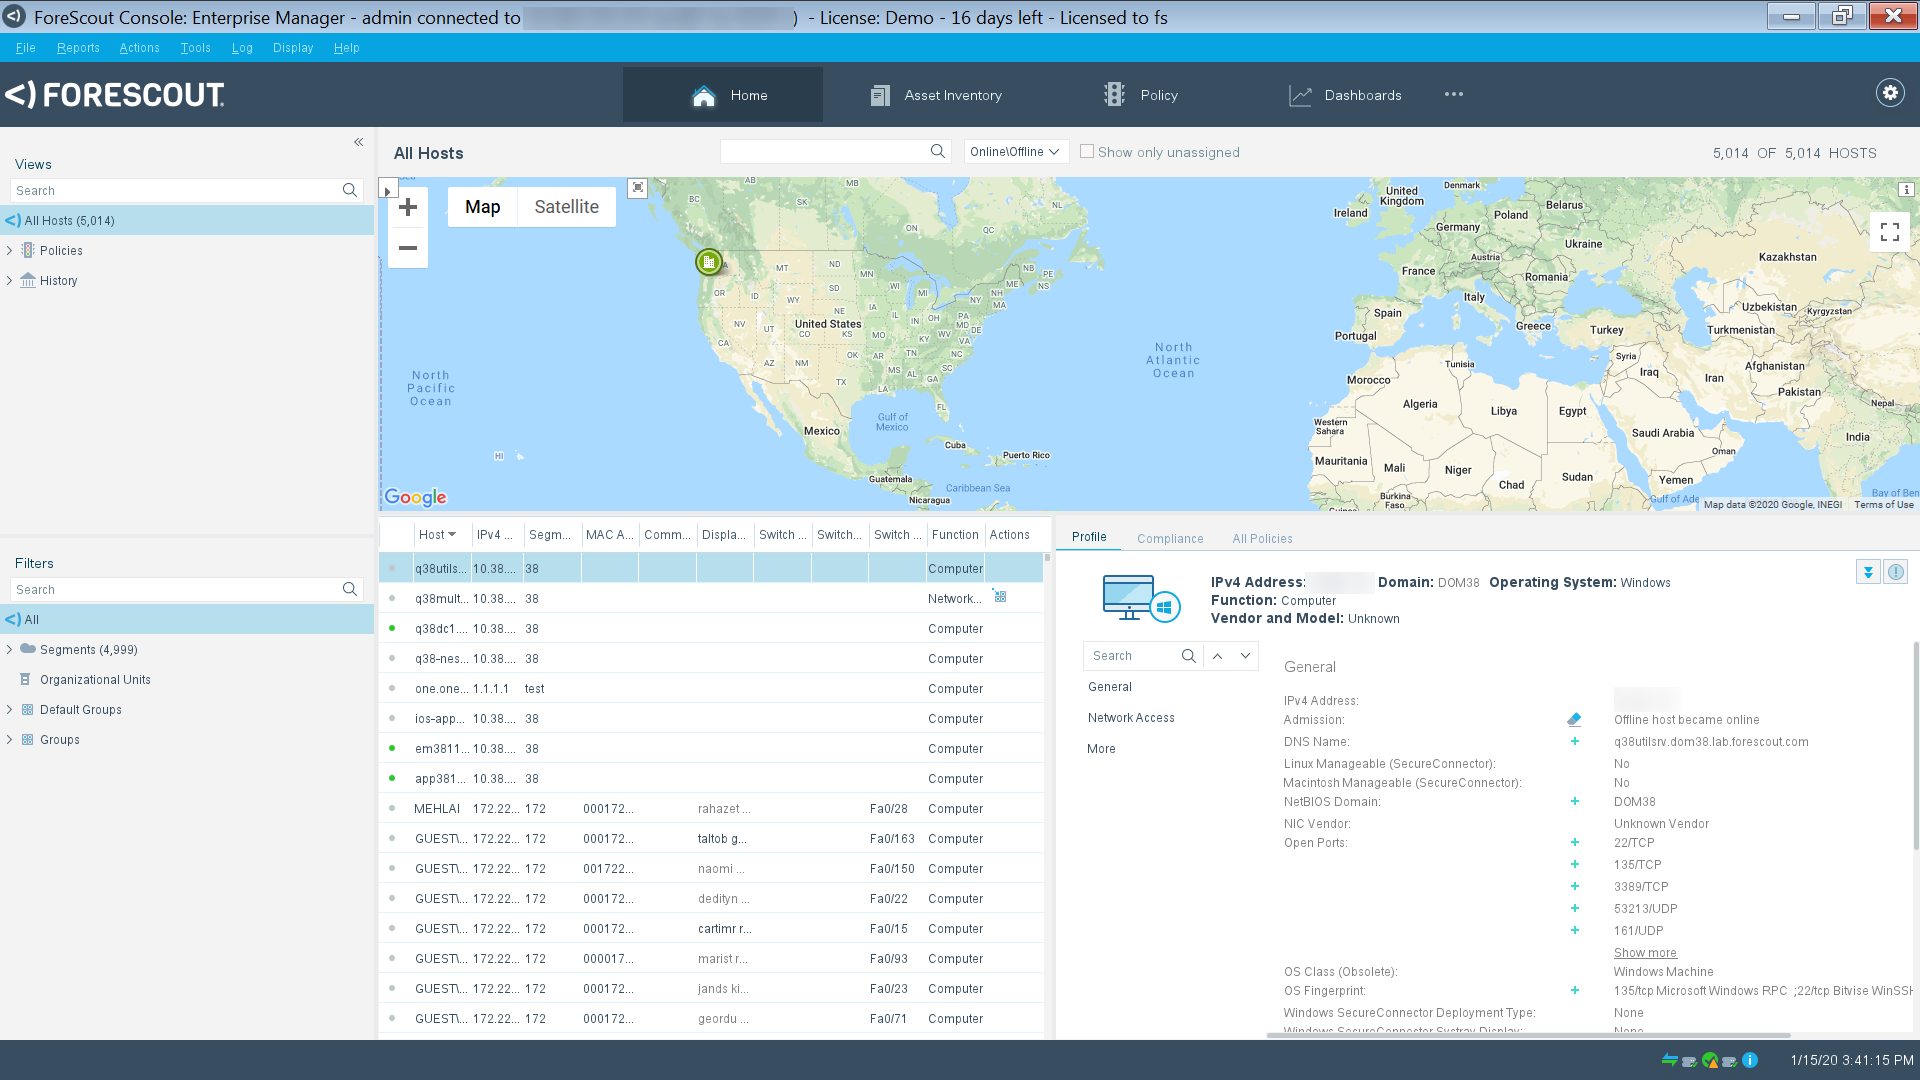
Use the map to get high-level status information for each site, such as:
- Total number of devices
- Non-compliant devices
- Unmanaged devices
- Devices without policies deployed
- Blocked devices
- Malicious devices
- Number of online and offline devices
- Number of corporate and guest devices Browser Requirements: The map runs on Internet Explorer 11.
Work with detections
The Console Home tab displays important details about endpoints detected by eyeSight policies. This information can include:
- Device information, for example, IP addresses, MAC addresses, DNS host name or NetBIOS host name
- Guest and compliance status
- Switch related information, for example, the switch port to which the endpoint is connected
- Endpoint and user identity information, for example, User Directory user name, email address, department
- Information related to actions taken at the endpoint and notifications sent to network users
Note: Users with an eyeSegment license can access Segmentation (eyeSegment application) from the toolbar.
The information displayed in the Detections pane varies depending on the selected Home view. See Home Views.
Deriving unique endpoints from observed addresses
eyeSight learns the IP and MAC addresses of endpoints and network nodes in the following ways:
- By auditing network traffic.
- By polling switches, controllers, domain controllers, and other network nodes.
- When optional plugins are installed that use additional information sources, such as flow protocols eyeSight analyzes this information to identify unique endpoints, and to correlate IP and MAC addresses to each endpoint.
- eyeSight data correlation logic uses only IPv4 addresses to identify unique endpoints. IPv6 addresses are not used to identify endpoints.
- When no IPv4 address correlates to a unique MAC address, eyeSight
lists this MAC-only endpoint with a placeholder IPv4 address in Console views.
This discovery and correlation logic is unchanged when IPv6 addressable endpoints are supported.
- Dual-stack endpoints are detected and displayed by their IPv4 addresses.
- IPv6-only endpoints are detected by their MAC addresses, and displayed using a placeholder IPv4 address (as is done for MAC-only endpoints without an IPv4 address).
For Console settings to enable detection of MAC-only and IPv6-only endpoints, see Work with Hosts without IPv4 Addresses.
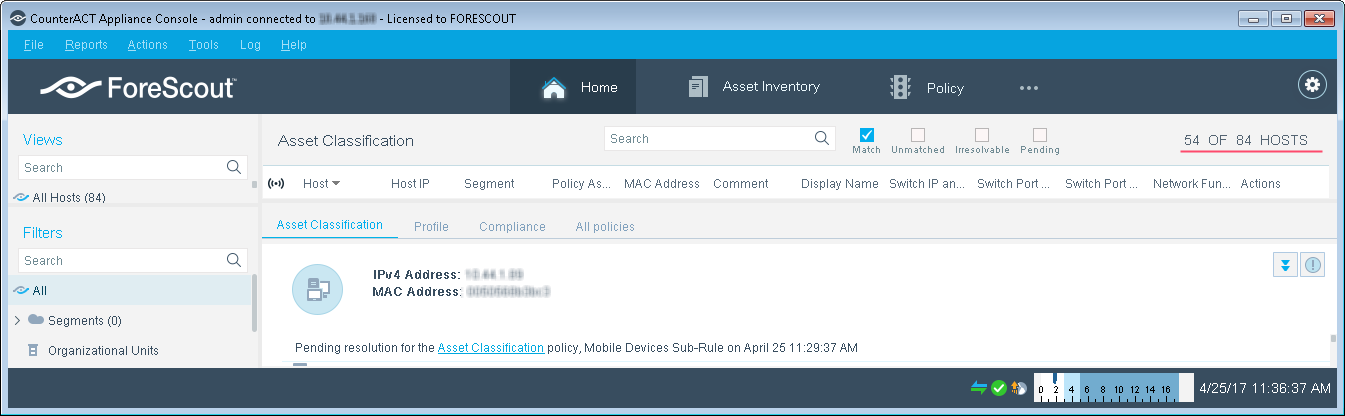
The Hosts indicator at the top right corner of the Detections pane displays the total number of endpoints detected for the folder or sub-folder you select. When there are a large amount of endpoints and it takes a long time to load the information to the Console, this indicator is updated to Showing X of X and displays the number of endpoints currently loaded out of the total detected.
About the Forescout Console details pane
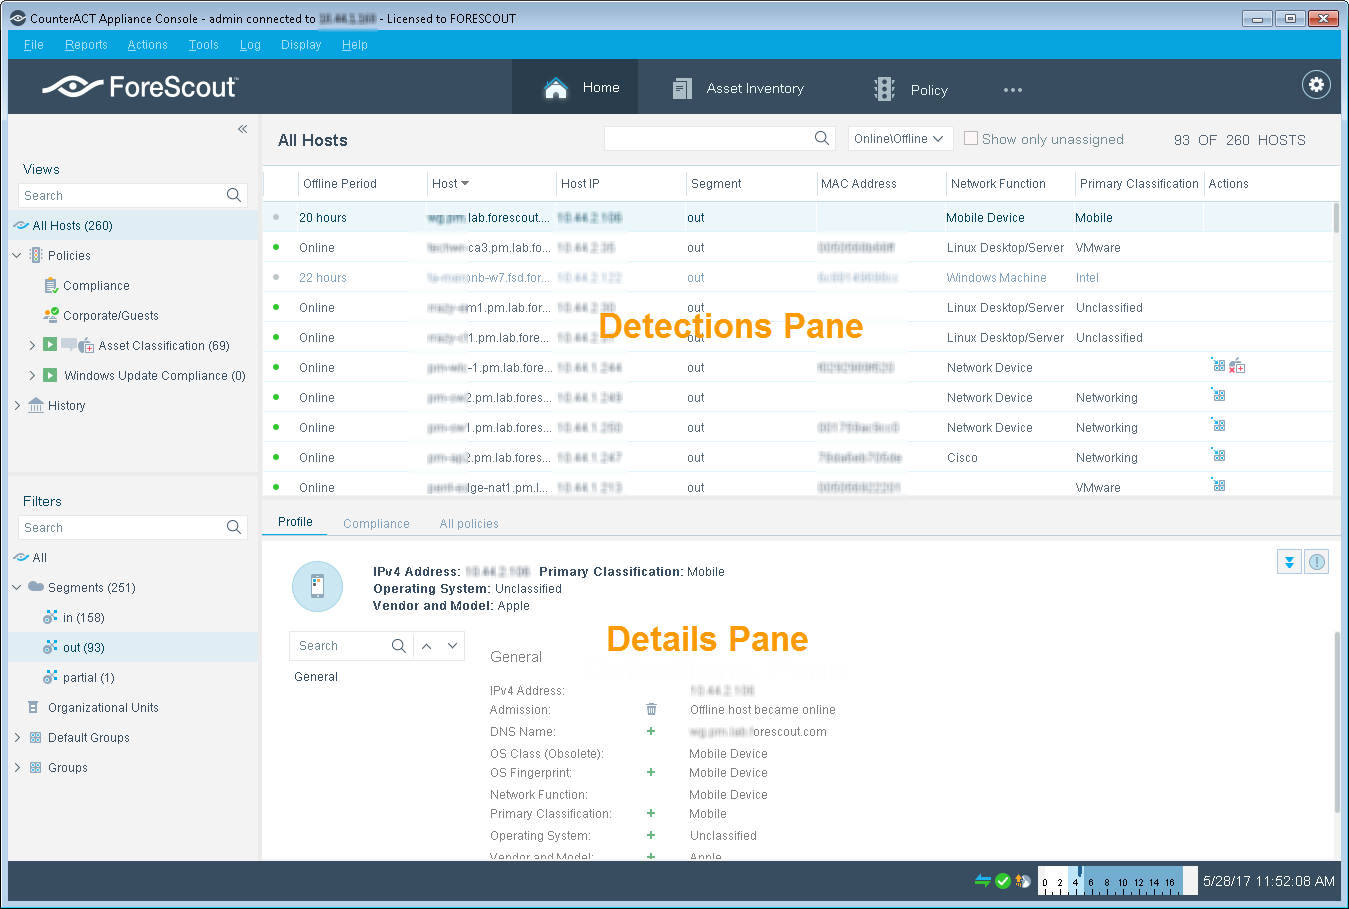
When you select an endpoint in the Detections pane, extensive details appear in the Details pane.
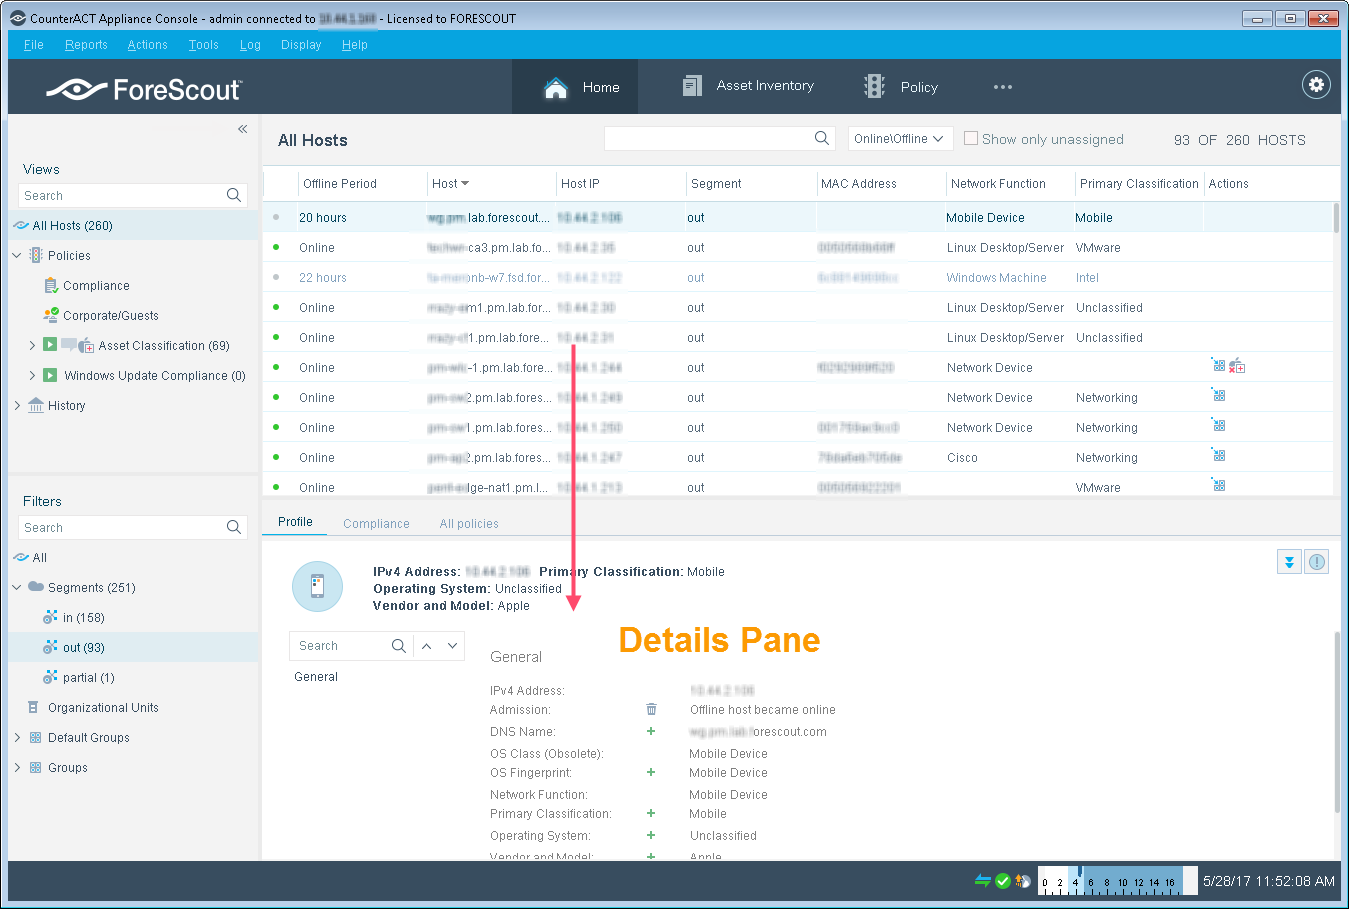
Forescout Console home views
The information displayed in the Detections pane varies depending on the selected Home view.
Forescout Console All Hosts view
The All Hosts view  displays all endpoints that eyeSight detects. This includes endpoints that are not part of a particular policy.
Policy view
The Policy view  displays endpoints detected as a result of policies created in the Policy Manager. Important detection statistics are provided. For example:
- The policy that the endpoint matched and when it was detected
- Machine information such as the IP address, MAC address, NetBIOS name and DNS name
- Actions taken at the endpoint, for example, if the endpoint was blocked or if access was prevented to the Internet
- User Directory information
- Automated notifications sent to endpoint users
- Information about endpoints that do not match the policy; endpoints that have been released from policy sanctions and endpoints that are pending inspection
Real-time policy status summary
You can view a real-time status summary for each policy. Policy status summaries are automatically updated in real time as the endpoint status changes.
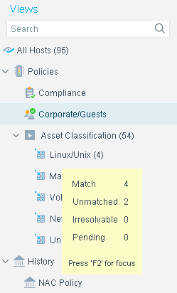
Compliance view
The Compliance view  displays endpoints that were detected in policies categorized as Compliance policies. By default, these include policies generated from Compliance templates.
Compliance categorization can also be configured in the Policy Manager.
Use this view to see information about the overall compliance status of endpoints included in such policies.
Select a specific endpoint to view a compliance summary for Compliance policies that inspected the endpoint.
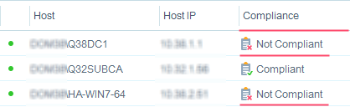
The Compliance column entry in the Detections pane indicates whether the endpoint is overall compliant. If an endpoint is inspected by several compliance policies and is not compliant in one, the endpoint is not compliant.
More specific compliance information is shown in the Details pane > Compliance tab, in the Forescout Compliance Center section. This information includes policy names, compliance issues, actions taken, remediation and last update time and the Status. If the Status indicates NA, the endpoint was not in the policy scope.
Corporate/guests view
The Corporate/Guests view  displays endpoints that were detected in policies categorized as Guest policies, including policies generated from the Corporate/Guest Control template. Categorization is performed in the Policy Manager.
This view displays information about the overall corporate or guest status of endpoints included in such policies.
History view
The History view  displays a filtered snapshot of detection and action information from a previous period. You can view information about malicious endpoints, Service Attacks, and policy detections. When you select a History view, a set of filters are displayed at the top of the Detections pane.

Work in the Detections pane
You can perform a variety of tasks from the Detections pane.
Track endpoints using the Detections pane filter
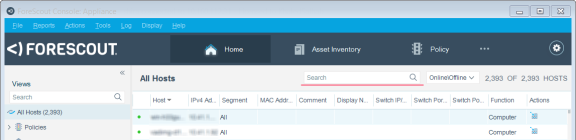
Use the Detections pane filter to quickly track endpoints of specific interest to you. Endpoints that meet the filter requirements appear as you type.
View table tooltip information
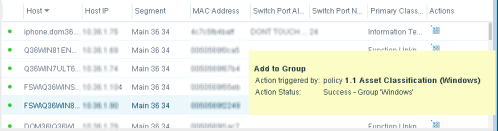
When you hover over an item in the table, a tooltip displays information regarding that item. For example, if you hold your cursor over the Action field, a tooltip displays detailed information regarding the action. Important troubleshooting information may be included. For example, an entry indicating that the endpoint has not been assigned to an Appliance and as a result is not monitored. For easier reading, select F2 to freeze the tooltip.
Configure the Detections pane columns
Default columns appear in the Detections pane with basic endpoint property details, actions taken at endpoints, and related information. The information varies according to the selected Home view. For each view, default information is displayed.
You can set change the layout and content of the columns in several ways.
Control endpoints from the Detections pane
Various options are available for controlling endpoints from the Detections pane. For example, you can:
- Start and cancel Forescout actions on selected endpoints
- Create endpoint exceptions
- Recheck endpoint status
- Clear property detections
- Add a customized comment about the endpoint
- Add the endpoint properties to a policy list
Work in the filters pane
The Filters pane provides tools that let you organize endpoints into logical categories, and then view them in the Detections pane per category.
This is important, for example, when managing networks with extensive detections.
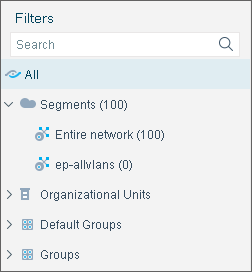
Several filter categories can be created.
Work with asset inventory detections
Select the Asset Inventory tab to view a live display of network activity at multiple levels, for example, running processes and services, detected vulnerabilities, open ports, and logged in users.
Use the Asset Inventory to:
- Broaden your view of the network from endpoint-specific to activity-specific.
- View endpoints that have been detected with specific attributes, whether or not they are policy-compliant.
- Easily track network activity and elements.
- Incorporate inventory detections into policies (black and white lists). For example, if you discover that network guests are running unauthorized processes on your network, create a policy that detects and halts these processes on guest machines.
The Asset Inventory is organized according to the following categories of network activity:
- Classification
- Microsoft Vulnerabilities detected
- Classification (Advanced)
- External Devices connected
- Users
- Applications Installed
- Guest Registration
- Switches integrated with the Forescout eyeSight
- User Directory
- Switch
- Open Ports
- Certain Windows, Linux and Macintosh activity and elements
- Geolocation
You can maximize smooth tracking of this activity by customizing the inventory categories into sub-categories. For example, you may discover via the Asset Inventory that your network is working with a variety of authorized and unauthorized processes. If this is the case, you could create lists of authorized and unauthorized processes under the Process Running property folder or lists of Switch IP addresses per VLAN under the Switch folder.
Inventories only show endpoints that are currently online.
Asset Inventory activities are queried and refreshed every 23 hours. The refresh frequency can be modified from the Inventory Discovery rule. See Endpoint Discovery Rules for details.
How the Asset Inventory is learned
The properties listed in the Asset Inventory view are learned using the following Forescout tools:
- Inventory Discovery Rules
- Detection Policies
Note: Certain inventory items may be learned passively by eyeSight. This happens when the Appliance is installed and starts monitoring your network. However, this information may only be gathered from part of your network. It is recommended not to rely solely on this information when working with the Asset Inventory.
Filter the asset inventory view
The following options are available for filtering the Asset Inventory view.
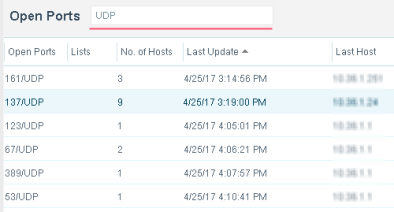
Use the Search tool to filter the Asset Inventory display. The filter is applied automatically as you type, with the matching Asset Inventory items immediately shown in the Asset Inventory view. For example, display all open UDP ports by typing in UDP in the filter field.
You can customize the Asset Inventory. For example, you may discover via the Asset Inventory that your network is working with a variety of authorized and unauthorized applications. In this case, you could create lists that itemize authorized and unauthorized applications under the Windows Applications Installed property folder or lists of Switch IP addresses per VLAN under the Switch folder. After you create lists, you can filter the Asset Inventory view according to those lists.
See Use Lists to Customize the Asset Inventory for details.
Asset inventory panes
The Asset Inventory is divided into the following areas:
- The Views Pane lists inventory categories based on endpoint properties and property lists that you create.
- The Detections Pane lists information about the inventory property category selected in the Views pane. For example, the number of endpoints running a specific process.
- The Hosts Pane displays all endpoints that are detected with the selected inventory item. For example, the endpoint IP address, MAC address, connected switch port, or User Directory name.
Inventories only show information detected at online endpoints.
Views pane
The Views pane shows the Asset Inventory items that you can view.
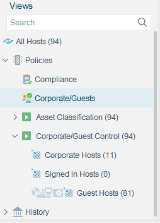
If plugins or (Undefined variable: product-names.eyeExtend) modules (Extended Modules) are installed, other items might be displayed, such as:
- Classification Properties
- Guest Registration
- Windows machines
- Function
- User Directory
- Microsoft Vulnerabilities detected
- Operating System
- Open Ports
- Services Running
- Vendor and Model
- Windows Applications Installed
- Switches integrated with the eyeSight
- Network Function
- External Devices connected
- Macintosh machines
- Advanced Classification Properties
- Linux machines
- Software Updates Missing
- Suggested Function
- Logged-in users
- Applications Installed
- Suggested Operating System
- Operating system versions running
- Users
- Processes Running
You can create lists for each of the property categories shown in the view. For example, create an Unauthorized Processes Running List under the Processes Running category, and add all unauthorized processes detected at your network to it.
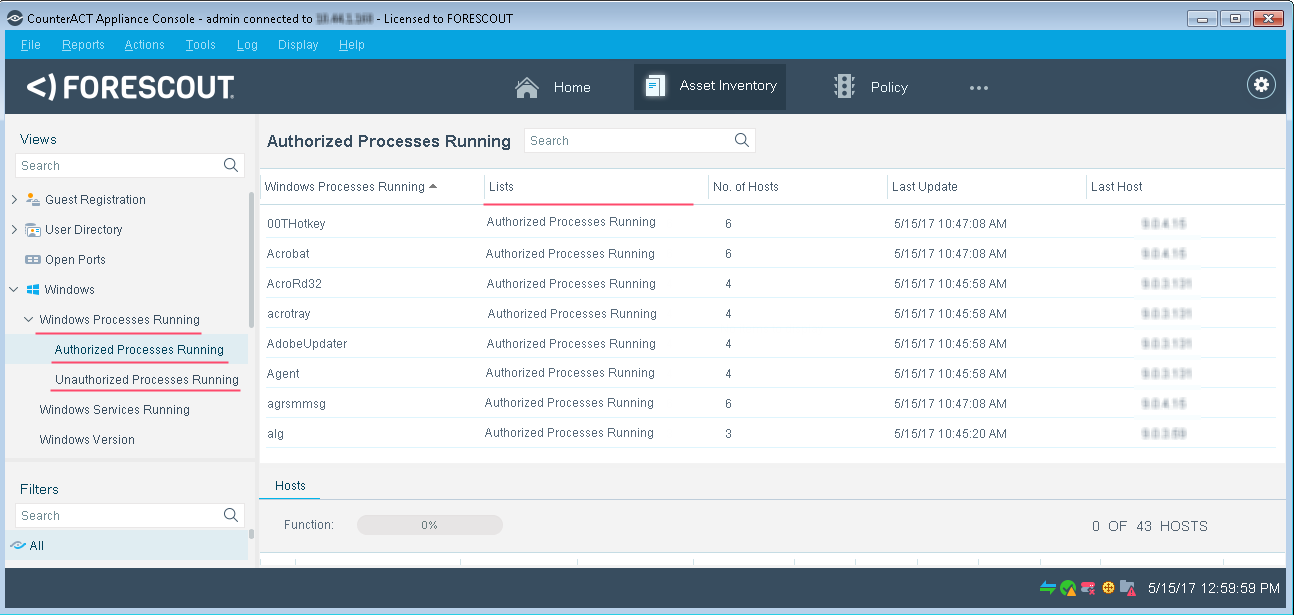
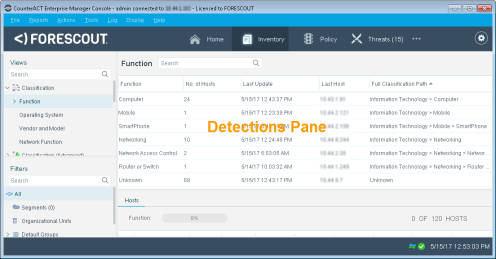
Detections pane
The Detections pane displays information about the property selected in the Views pane. Previously, the Detection pane read and showed only limited columns, resulting in missing data. Now, it reads all the columns and shows limited columns that were shown previously; however, you can add or remove additional columns for the selected view category.
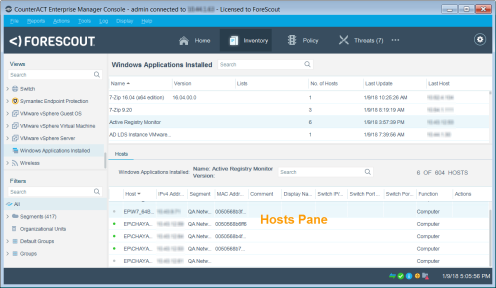
Hosts pane
The Hosts pane displays the endpoints that have been detected for the Asset Inventory item selected. Previously, you would see missing data for several hardware properties; however, data for all properties can now be viewed. Use the tools available when working with endpoint detections to handle these endpoints. For example, you can assign actions to endpoints or drill down to get more detailed endpoint information. Use the search tool at the top of the pane to filter endpoints. See Control Endpoints from the Detections pane for details.
Use lists to customize the asset inventory
The Asset Inventory automatically detects a wide range of network activity that you can organize into logical categories. For example, you may discover via the Asset Inventory that your network is working with a variety of authorized and unauthorized processes. If this is the case, you can create Lists of authorized and unauthorized processes under the Process Running property folder or lists of Switch IP addresses per VLAN under the Switch folder.
Working with inventory lists enables more customized, smoother tracking of network activity.
You can use lists when working with policies. For example, create a policy that tracks and stops machines running unauthorized processes. See Defining and Managing Lists for details.
Work with eyeSight segments
Segments are named groups of IP addresses. Use segments to represent your network in the Console in a way that reflects your organizational structure.
Segments let you organize endpoints into logical categories within Forescout. For example, you can define segments for Sales or Finance departments in your organization. Sub-segments can also be created: Create a Sales category and, under that, Local Sales and International Sales categories.
The segments you create appear in the Filters pane of the Console.

After you define segments, you can use them to:
- Filter the Detections pane. For example, display endpoints in the Sales department that match a specific policy.
- Specify IP addresses for Forescout features. For example, use predefined segments to specify the scope of a policy, antivirus tool, or Virtual Firewall.
- Work with the site Map. For example, create a location called NYC-HQ, New York and then assign the respective segments in the NYC-HQ office network to this location. See Set Up the Map - Create Site Locations for details.
- Create reports based on segments, for example, Compliance trends per segment. See Generating Reports and Logs for details.
When you work with segments:
- Modifying an existing segment changes the IP addresses that are referenced by the segment wherever it is used in eyeSight. For example, the scope of policies may change, or the Appliance that handles certain IP addresses may change.
- You can use the Audit Trails reports to search for information about users who have modified segment definitions.
- One set of segments is shared among all eyeSight.
Remove segments from the tree
Removing segments from the Segment tree only deletes the segment name. If you have already assigned IP addresses to this segment, Forescout products still handle endpoints with those IP addresses.
However, references to the segment in policies and other areas of the Console indicate that no segment name is assigned.
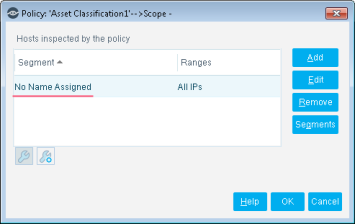
Conversely, if you remove IP assignments from the Ranges area, those IP addresses are no longer included in the segment.
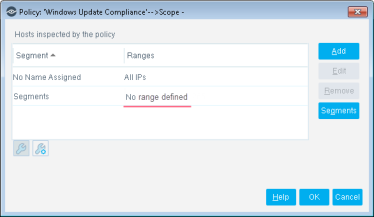
If only empty segments are assigned to a failover cluster, and you want to remove one of the segments, you must first remove it from all failover cluster folder assignments before you remove it from the Segment tree. See Working with Appliance Folders and the Forescout eyeSight Resiliency and Recovery Solutions User Guide for more information.
File formats for importing and exporting the segment tree
You can export or import the entire segment tree or a specific segment. You may want to export segments if you are doing extensive editing and additions and want to use an external tool. You can also use the exported file as a template that reflects the file format required for importing.
Segment data (segment names and address ranges) is imported or exported in two file formats: XML or CSV.
A typical CSV file has the following format:
Segment ID,Parent Segment ID,Current Segment ID,Segment
Name,From,To,Segment Description0,-1,0,Segments,,,1,0,3921800411724927309,internal network,10.160.50.1,10.160.50.120,
After the header line, each segment is as a line of the file, with the following fields:
Common spreadsheet applications can be used to edit CSV files, as shown below.
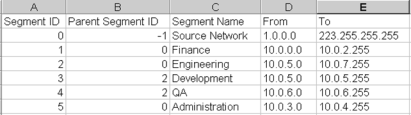
The same simple tree shown in CSV format is shown below in XML format.
<?xml version="1.0" encoding="UTF-8" standalone="no"?>GROUP DESCRIPTION="" NAME="Segments" SEGMENT_ID="0" UPGRADE_PERFORMED="true"><GROUP DESCRIPTION="" NAME="internal network" SEGMENT_ID="3921800411724927309" UPGRADE_PERFORMED="true"><RANGES RANGE="10.160.50.1-10.160.50.120"/></GROUP></GROUP>
The <GROUP> element is used to define segments, and can be nested to show tree structure. The segment name, description, and unique numerical ID are represented by attributes of the <GROUP> element.
The <RANGE> element is used to define IP addresses in the segment.
 minute read